Image Details
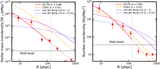
Caption: Figure 3.
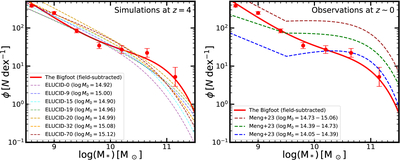
The total SMF of Bigfoot compared with massive clusters with M0 ∼ 1015M⊙. The left figure shows that Bigfoot has a comparable number of galaxies and occupied volume to simulated progenitors of Coma-type massive galaxy clusters, where the red line shows the total SMF of the nine subgroups of PCL0217 at zspec = 3.97–4.00 subtracted by a predicted contribution from the field SMF. The dashed lines show the total SMF of the progenitors (z = 4.04) of the seven most massive galaxy clusters (M0 ∼ 1015M⊙) from the ELUCID simulation (H. Wang et al. 2014). The right panel compares the total SMF of Bigfoot with the observed mass functions of red galaxies in local clusters from DESI and the Sloan Digital Sky Survey (J. Meng et al. 2023).
Other Images in This Article
Copyright and Terms & Conditions
© 2025. The Author(s). Published by the American Astronomical Society.