Image Details
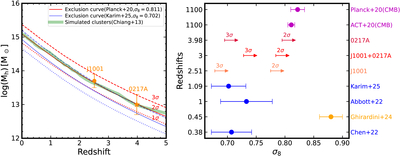
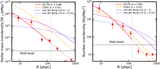
Caption: Figure 6.
The halo mass of 0217A compared with the constraint from cosmology and the simulated clusters. In the left panel, the orange star shows the halo mass and redshift of 0217A. The red dotted, solid, and dashed lines show the 0.683 (1σ), 0.954 (2σ), and 0.997 (3σ) exclusion curves (I. Harrison & S. Hotchkiss 2013) in the 0.17 deg2 area under the Planck cosmology with σ8 = 0.811 ± 0.006 and Ωm = 0.315 ± 0.007 (Planck Collaboration et al. 2020). The blue lines show the exclusion curves under the cosmology measured by DESI (T. Karim et al. 2025) with σ8 = 0.702 ± 0.030 and Ωm = 0.285 ± 0.010. The green line shows the mass evolution of the most massive progenitor halo in the simulated massive clusters with M0 > 1015M⊙ (Y.-K. Chiang et al. 2013). In the right panel, the blue points show the σ8 measured by the low-redshift probes from BOSS (S.-F. Chen et al. 2022), DES year 3 (T. M. C. Abbott et al. 2022), and the DESI Legacy Imaging Surveys (T. Karim et al. 2025); the orange point shows the σ8 constrained by the local galaxy clusters from the SRG/eROSITA all-sky survey (V. Ghirardini et al. 2024); the arrows show the limits of σ8 under which Bigfoot, J1001, and the combination of them meet the 0.954 (2σ) and 0.997 (3σ) exclusions; and the magenta points show the σ8 measured with CMB (S. Aiola et al. 2020; Planck Collaboration et al. 2020).
Other Images in This Article
Copyright and Terms & Conditions
© 2025. The Author(s). Published by the American Astronomical Society.