Image Details
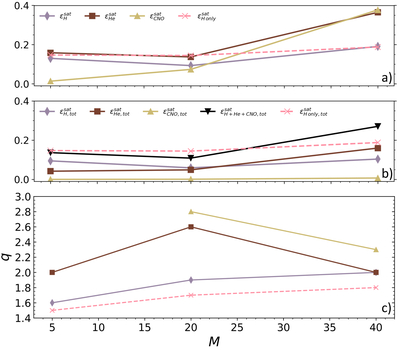
Caption: Figure 3.
As a function of Mach number we show the individual injection efficiency εs (panel (a)), the total injection efficiency εs,tot (panel (b)), and the slope of the nonthermal tail for different species (panel (c)) at ﹩t=500\,{\omega }_{c}^{-1}﹩ (the superscript sat refers to the measurement done at this specific time, when the efficiencies have saturated).
Other Images in This Article
Copyright and Terms & Conditions
© 2025. The Author(s). Published by the American Astronomical Society.
Copyright ©
2025 Astronomy Image Explorer. All Rights Reserved.