Image Details
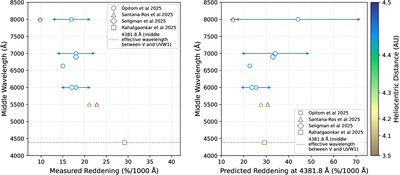
Caption: Figure 4.
Compilation of reddening measurements for 3I/ATLAS. Left panel: reddening measurements of 3I/ATLAS in literature versus the central wavelength of the measurement bands. Marker shapes denote references; colors indicate heliocentric distance (colorbar at far right). Black dashed line marks the middle effective wavelength between V and UVW1 (4381.8 Å). Right panel: same measurements converted to reddening at the middle effective wavelength between V and UVW1. Y-axis shows original measurement wavelengths; x-axis shows converted reddening values at our middle wavelength. Symbols and colorbar as in the left panel.
Other Images in This Article
Copyright and Terms & Conditions
© 2025. The Author(s). Published by the American Astronomical Society.