Image Details
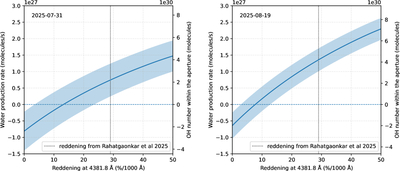
Caption: Figure 3.
Dependence of number of OH molecules within the 10″ aperture and water production rate on reddening. The left panel presents results from the July 31 visit, while the right panel shows results from the August 19 visit. In each panel, the blue line shows the number of OH molecules and corresponding water production rates as a function of assumed reddening between V and UVW1 effective wavelengths. Shaded regions indicate 1σ stochastic uncertainty. The black dotted line indicates the reddening measured at the same wavelength range using reflectance spectra from R. Rahatgaonkar et al. (2025; private communication). The blue dashed line denotes zero production rate.
Other Images in This Article
Copyright and Terms & Conditions
© 2025. The Author(s). Published by the American Astronomical Society.