Image Details
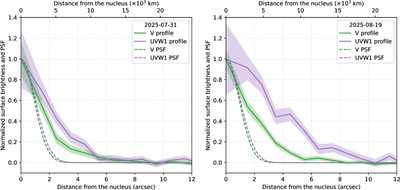
Caption: Figure 2.
Radial surface brightness profiles of 3I/Atlas in the V and UVW1 images for two observation visits. The left panel corresponds to the July 31 visit and the right panel to August 19. In each panel, solid lines represent the measured profiles, while shaded regions indicate 1σ stochastic uncertainty. Dashed lines represent the instrumental PSF for each filter. All profiles are normalized to the brightness at the nucleus. The profiles for the V filter are represented in green, while the UVW1 profiles are depicted in purple.
Other Images in This Article
Copyright and Terms & Conditions
© 2025. The Author(s). Published by the American Astronomical Society.
Copyright ©
2025 Astronomy Image Explorer. All Rights Reserved.