Image Details
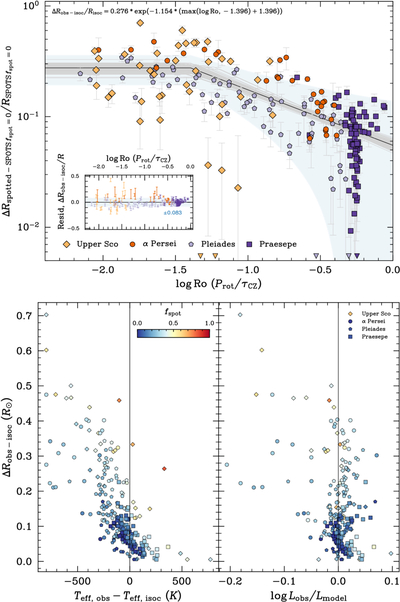
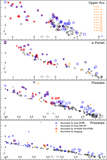
Caption: Figure 2.
(Top) Degree of (fractional) radius inflation for our study sample, determined in relation to standard, nonmagnetic, unspotted stellar isochrone models, as a function of the rotational Rossby number. Stars are color-coded and assigned a marker by their cluster membership. The black line is the fiducial “best fit” for the power-law relation, and the gray lines indicate alternate sampled solutions of the MCMC chain (representing the uncertainty of the solution), with the blue band representing the standard deviation of points about the best-fit line. Points that fall off the edges of the plot limits are denoted by triangle symbols but are still included in the fit. (Bottom) Observed radius inflation as a function of temperature suppression (left) and luminosity offsets from SPOTS isochrones (right). Temperature suppression is observed to correlate with radius inflation in a manner that preserves the luminosity.
Other Images in This Article
Copyright and Terms & Conditions
© 2025. The Author(s). Published by the American Astronomical Society.