Image Details
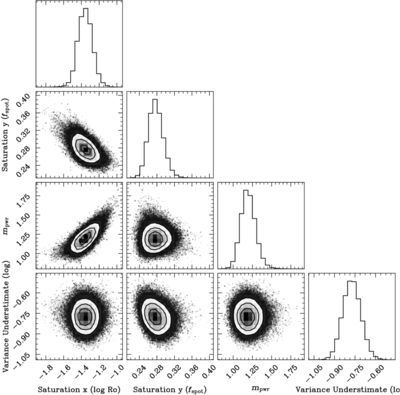
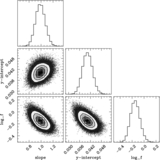
Caption: Figure B1.
Markov Chain Monte Carlo corner plots showing parameters recovered for the power-law fit in Figure 2. The best-fit values are, for rotational saturation: ﹩\mathrm{log}{{\rm{Ro}}}_{{\rm{crit}}}=-1.39{6}_{-0.070}^{+0.076}﹩; spot saturation level: ﹩{f}_{\mathrm{spot},\mathrm{sat}}=0.27{6}_{-0.016}^{+0.017}﹩; slope at ﹩\mathrm{log}{\rm{Ro}}\gt \mathrm{log}{{\rm{Ro}}}_{{\rm{crit}}}﹩: ﹩{m}_{{\rm{slope}}}=1.15{4}_{-0.081}^{+0.087}﹩.
Other Images in This Article
Copyright and Terms & Conditions
© 2025. The Author(s). Published by the American Astronomical Society.
Copyright ©
2025 Astronomy Image Explorer. All Rights Reserved.