Image Details
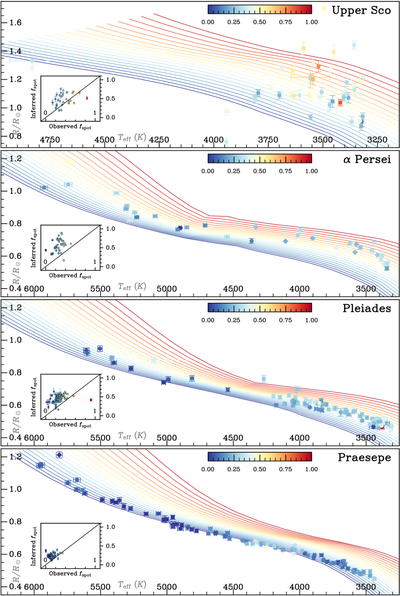
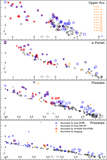
Caption: Figure 3.
Comparisons of radii and temperatures recovered for individual stars with those predicted by the SPOTS models, as a function of fspot. Markers are colored by their fspot and lines are also colored by the corresponding fspot theoretical starspot isochrones from SPOTS. Inset plots relate the observed fspot recovered from the spectra (x-axis) to the spot filling fraction inferred from the isochrones using the measured radii (y-axis).
Other Images in This Article
Copyright and Terms & Conditions
© 2025. The Author(s). Published by the American Astronomical Society.
Copyright ©
2025 Astronomy Image Explorer. All Rights Reserved.