Image Details
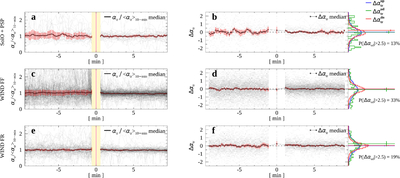
Caption: Figure 3.
Statistical evolution of normalized spectral index ﹩{\alpha }_{\mathrm{tr}}/{\langle {\alpha }_{\mathrm{tr}}\rangle }_{10\,\,\rm{minutes}\,}﹩ and ﹩{\rm{\Delta }}\alpha {\rm{tr}}﹩ across FF and FR shocks. (a)–(b) Results from SolO and PSP FF shocks; (c)–(d) Wind FF shocks; (e)–(f) Wind FR shocks. In all panels, medians (black lines or dots) and their errors (red bars) are shown. Histograms display distributions of ﹩{\rm{\Delta }}{\alpha }_{{\rm{tr}}}^{{\rm{up}}}﹩ (blue), ﹩{\rm{\Delta }}{\alpha }_{{\rm{tr}}}^{{\rm{md}}}﹩ (green), and ﹩{\rm{\Delta }}{\alpha }_{{\rm{tr}}}^{{\rm{dn}}}﹩ (red). For clarity in visualization, we limit the display range to ﹩| {\rm{\Delta }}{\alpha }_{{\rm{tr}}}^{{\rm{ud}}}| \lt 2.5﹩, while values exceeding this threshold are represented as a fraction of the total number of ﹩{\rm{\Delta }}{\alpha }_{{\rm{tr}}}^{{\rm{ud}}}﹩. The time for FR shocks is flipped for consistency: negative (positive) times correspond to upstream (downstream).
Other Images in This Article
Copyright and Terms & Conditions
© 2025. The Author(s). Published by the American Astronomical Society.