Image Details
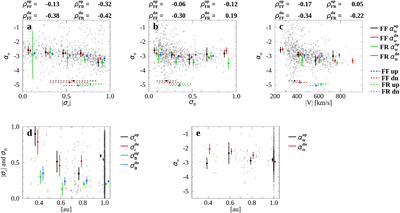
Caption: Figure 4.
Correlations between transition range spectral index ﹩{\alpha }_{{\rm{tr}}}﹩ and turbulence parameters estimated over 10 minute intervals. (a) ﹩{\alpha }_{{\rm{tr}}}﹩ vs. the absolute value of normalized cross helicity ∣σc∣, (b) ﹩{\alpha }_{{\rm{tr}}}﹩ vs. normalized fluctuation amplitude σB, and (c) ﹩{\alpha }_{{\rm{tr}}}﹩ vs. bulk speed ∣V∣. Dots and vertical bars indicate medians and their error; horizontal dashed lines show parameter medians and interquartiles. (d) Radial trends of ∣σc∣ and σB for FF shocks (upstream: black/green; downstream: red/blue). (e) Corresponding trend in ﹩{\alpha }_{{\rm{tr}}}﹩. Data are drawn from SolO, PSP, and Wind FF shock sets.
Other Images in This Article
Copyright and Terms & Conditions
© 2025. The Author(s). Published by the American Astronomical Society.