Image Details
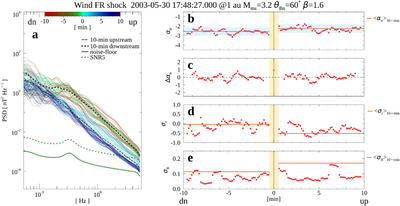
Caption: Figure 2.
Evolution of turbulence parameters across a FR shock observed by Wind on 2003 May 30. (a) Magnetic field power spectra over ±10 minutes. (b) Temporal evolution of ﹩{\alpha }_{{\rm{tr}}}﹩; the shaded region denotes 2σ from ﹩{\langle {\alpha }_{\mathrm{tr}}\rangle }_{10\,\mathrm{minutes}}﹩. (c) Change in spectral index, ﹩{\rm{\Delta }}{\alpha }_{{\rm{tr}}}﹩. (d) Normalized cross helicity, ∣σc∣, and (e) fluctuation amplitude, σB. Negative (positive) times indicate downstream (upstream) due to the spacecraft-frame geometry for FR shocks with a subscript “dn” (“up”). Magenta vertical lines mark the shock crossing, and yellow-shaded intervals around t = 0 are excluded from statistical analysis.
Other Images in This Article
Copyright and Terms & Conditions
© 2025. The Author(s). Published by the American Astronomical Society.