Image Details
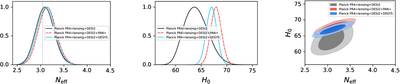
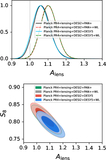
Caption: Figure 6.
The left and middle panels show the 1D posterior distributions of Neff and H0 (km s−1 Mpc−1), respectively, for various data combinations. The dashed vertical line in the left panel corresponds to the standard model value of Neff = 3.044. The right panel shows the 2D correlation plot between the two parameters, showing a strong correlation between them.
Other Images in This Article
Copyright and Terms & Conditions
© 2025. The Author(s). Published by the American Astronomical Society.
Copyright ©
2026 Astronomy Image Explorer. All Rights Reserved.