Image Details
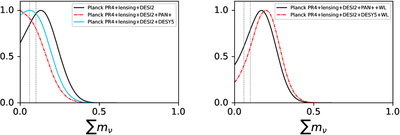
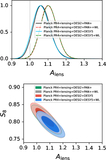
Caption: Figure 2.
A comparison of the 1D marginalized posterior distributions for ∑mν (eV) across various data combinations. The panel on the right shows results with the DES Year 1 WL included. Note that in the right panel, the Planck PR4+lensing+DESI2+DESY5+WL data set combination leads to a 2σ+ detection of nonzero ∑mν. The two vertical black dashed lines (in both panels) indicate the minimum mass thresholds for the normal (0.057 eV) and inverted (0.096 eV) neutrino mass hierarchies, respectively.
Other Images in This Article
Copyright and Terms & Conditions
© 2025. The Author(s). Published by the American Astronomical Society.
Copyright ©
2026 Astronomy Image Explorer. All Rights Reserved.