Image Details
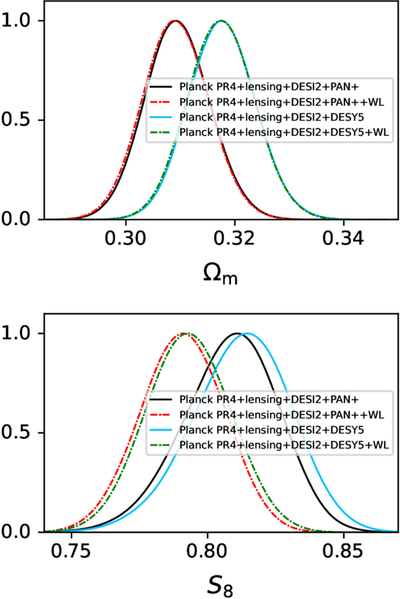
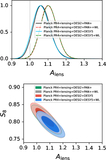
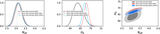
Caption: Figure 4.
A comparison of the 1D marginalized posterior distributions for Ωm and S8 across various data combinations. Note that the Ωm posteriors remain similar with the addition of WL data, but the S8 values are lowered.
Other Images in This Article
Copyright and Terms & Conditions
© 2025. The Author(s). Published by the American Astronomical Society.
Copyright ©
2026 Astronomy Image Explorer. All Rights Reserved.