Image Details
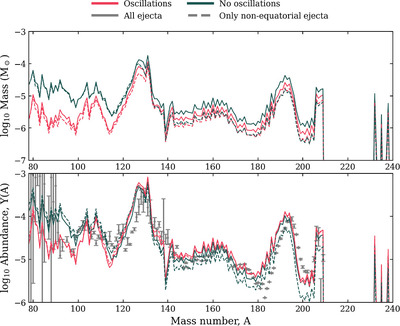
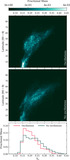
Caption: Figure 5.
Top: total mass of each element produced, as a function of mass number. Bottom: mass-weighted relative abundances of each element produced, with solar abundances shown as gray diamonds. In each case, we plot both the yields from the outflows with (pink) and without (teal) oscillations. We show the results considering all ejecta (solid lines) as well as nonequatorial ejecta (dashed), as described in Section 3.
Other Images in This Article
Copyright and Terms & Conditions
© 2025. The Author(s). Published by the American Astronomical Society.
Copyright ©
2026 Astronomy Image Explorer. All Rights Reserved.