Image Details
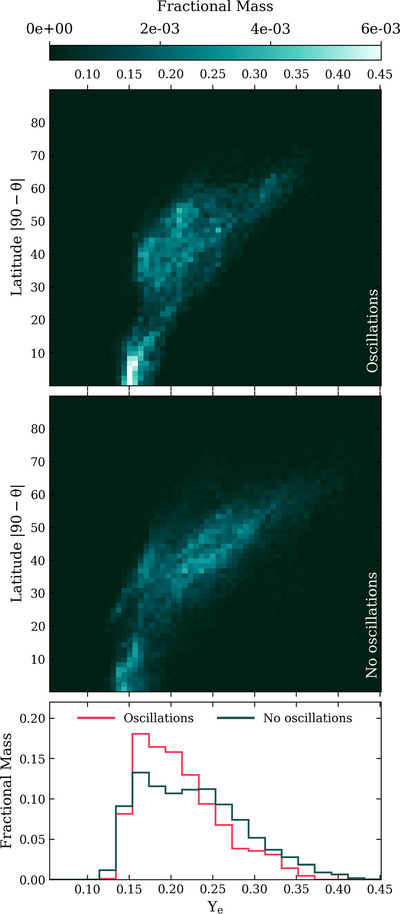
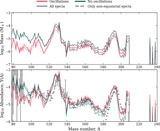
Caption: Figure 4.
Mass distribution of Ye as the ejecta passes through 10 GK. The top two panels show the distribution of Ye as a function of latitude, with zero representing the plane of the disk. The bottom panel shows the fractional mass distribution for the simulation with (pink) and without (teal) oscillations. The outflow in the simulation with FFCs shifts to lower Ye, especially at higher latitudes, indicating enhanced neutron richness in the ejecta.
Other Images in This Article
Copyright and Terms & Conditions
© 2025. The Author(s). Published by the American Astronomical Society.
Copyright ©
2026 Astronomy Image Explorer. All Rights Reserved.