Image Details
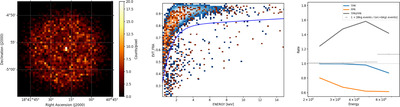
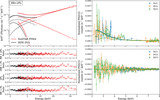
Caption: Figure 7.
Left: Counts map of the rejected component by the cut devised in A. Di Marco et al. (2023). Middle: Heat maps (with the source region shown in blue shades and the background region in red shades) of the energy fraction contained in the main cluster (EVT_FRA) of the event reconstructed in the detector as a function of the reconstructed energy; the blue line illustrates the background rejection cut, which removes all event below it. Right: FPR and TPR, defined as described in the text, in blue and orange respectively; the dark gray line corresponds to the ratio between the TPR and FPR; the light gray point shows the ratio between the number of counts in the background region and the source region in each energy bin (the ratio is scaled up by 1 for visualization purposes).
Other Images in This Article
Copyright and Terms & Conditions
© 2025. The Author(s). Published by the American Astronomical Society.