Image Details
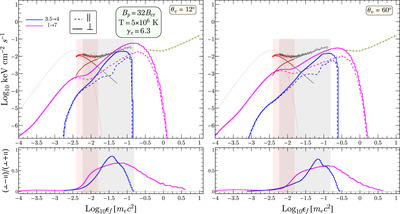
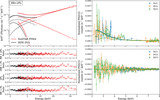
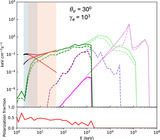
Caption: Figure 5.
Pure RICS model spectra, without splitting attenuation or cascades, integrated over toroidal volumes as indicated by two ranges of field footpoint altitudes in units of stellar radii, with ﹩{r}_{{\rm{\max }}}\in \{{2}^{3.5},{2}^{4}\}﹩ shown in blue and ﹩{r}_{{\rm{\max }}}\in \{{2}^{1},{2}^{7}\}﹩ in magenta. A blackbody with appropriate area and T = 5 × 10⁶ K is plotted in dotted red. The left and right panels depict viewing angles of θv = {12°, 60°} with respect to the magnetic pole, as indicated. The bottom row depicts the polarization degrees, which trace the ⊥ modes preferentially resulting from scattering, which map to solid and dashed curves in the upper panel. IXPE and NuSTAR data for 1E 1841−045 are plotted, and the energy ranges of the two instruments are indicated with relevant shading. The brown dashed–dotted curve depicts the 2 yr continuum sensitivity for COSI (J. Tomsick et al. 2023).
Other Images in This Article
Copyright and Terms & Conditions
© 2025. The Author(s). Published by the American Astronomical Society.