Image Details
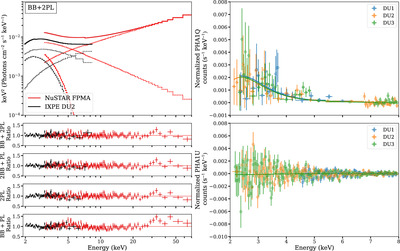
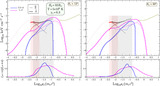
Caption: Figure 4.
The joint spectral νFν models of the simultaneous NuSTAR+IXPE observation. The upper left panel shows the best-fit model of constant∗tbabs(polconst∗bbodyrad+polconst∗powerlaw+polconst∗powerlaw). Note: Only NuSTAR FPMA and DU2 are displayed, to enhance visual clarity. The second left panel shows the data divided by the folded model for the absorbed BB+2PL model; the third, fourth, and bottom left panels show the ratio between the data and the folded model for an absorbed 2BB+PL, 2PL, and BB+PL for comparison. The right panels show the normalized Stokes Q (top) and U (bottom) spectra for the 3 IXPE DUs, with the solid lines showing the best-fit model in linear space. Best-fit spectral parameters can be found in Table 1.
Other Images in This Article
Copyright and Terms & Conditions
© 2025. The Author(s). Published by the American Astronomical Society.