Image Details
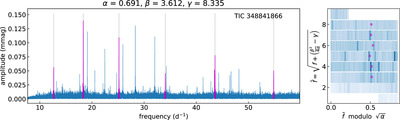
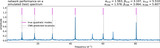
Caption: Figure 6. Oscillation spectra
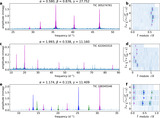
The complete figure set (85 images) is available in the online journal.
The oscillation spectrum of one of the star showing quadratically dispersed modes. (Left) The identified modes are highlighted as well as marked with dashed lines. The (α, β, γ) coefficients (in day−1) obtained from fitting the identified modes is displayed in the title. (Right) The stretched échelle diagram constructed using the (α, β, γ) coefficients following the method discussed in Section A.4. The modes identified in the spectrum on left are shown with open square symbols in the échelle diagram.
Other Images in This Article

Copyright and Terms & Conditions
© 2024. The Author(s). Published by the American Astronomical Society.
Copyright ©
2026 Astronomy Image Explorer. All Rights Reserved.