Image Details
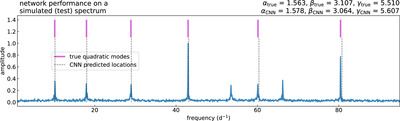
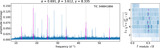
Caption: Figure 4.
Demonstrating the method’s performance on a simulated (test) δ Scuti–like oscillation spectrum with six quadratically arranged frequencies and two chaotic modes. The original (α, β, γ) values used to construct this spectrum are specified in the figure title, along with the corresponding values inferred by the CNN. Based on this inference, we mark with dashed lines the expected frequency location where the quadratic modes may appear. Also shown are the positions of the original quadratic modes in the simulated spectrum, to which CNN’s identifications are close.
Other Images in This Article

Copyright and Terms & Conditions
© 2024. The Author(s). Published by the American Astronomical Society.
Copyright ©
2026 Astronomy Image Explorer. All Rights Reserved.