Image Details
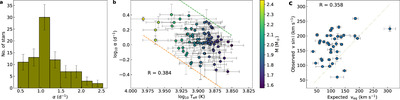
Caption: Figure 2.
Coefficient α is related to stellar rotation. (a) The distribution of α for 80 stars, seen to peak around 1 day−1, is comparable to typical rotation rates of δ Sct stars. (b) Inferred rotational rate (α) appears to be related to T eff. Points are color coded by stellar mass—darker colors indicate lower masses. (c) Spectroscopically observed line-of-sight projected rotational velocities (﹩v\,\sin \,i﹩) plotted against v eq = 2π α R ⋆, i.e., treating α as if it were the equatorial rotation rate. The straight line marks ﹩v\,\sin \,i={v}_{{\rm{eq}}}﹩. Although we expect ﹩v\,\sin \,i﹩ to be smaller than v eq, the similarity between the two independent inferences is suggestive of α being closely related to rotation. If our interpretation were to hold, α is systematically underestimated based on this plot.
Other Images in This Article

Copyright and Terms & Conditions
© 2024. The Author(s). Published by the American Astronomical Society.