Image Details

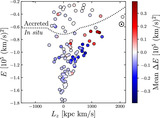
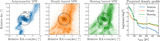
Caption: Figure 2.
Present day energy E vs. z-component of angular momentum L z for GCs (left-hand panel), stars with [Fe/H] < −1 (middle panel), and our test particle simulation with a rotating bar (right-hand panel). In each panel the large red points mark the 10 selected GCs with the largest mean changes in L z due to the slowing bar. The black dotted line in the left-hand panel marks the boundary between accreted (higher E) and in situ (lower E) GCs according to Belokurov & Kravtsov (2023, 2024), and the Sun is marked with a ⊙ symbol.
Other Images in This Article
Copyright and Terms & Conditions
© 2024. The Author(s). Published by the American Astronomical Society.