Image Details
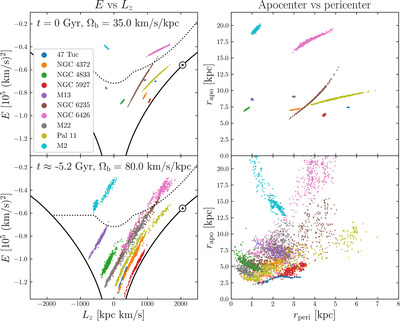
Caption: Figure 4.
Changes in the orbits of the 10 GCs in a slowing barred potential. The top and bottom rows show the present day t = 0 and t = t 0 ≈ −5.24 Gyr, at which the pattern speeds are Ωb = 35 and 80 km s−1 kpc−1, respectively. The left- and right-hand columns show energy vs. angular momentum and apocenter vs. pericenter, respectively. Each of the 10 clusters is on average at lower energy and angular momentum at the earlier time. In some cases (e.g., M22) the pericenters are also considerably smaller than their current values.
Other Images in This Article
Copyright and Terms & Conditions
© 2024. The Author(s). Published by the American Astronomical Society.
Copyright ©
2025 Astronomy Image Explorer. All Rights Reserved.