Image Details
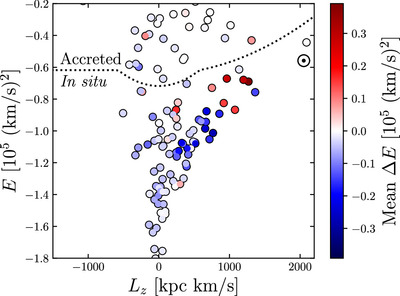
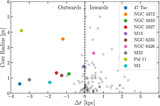
Caption: Figure 1.
Energy E vs. angular momenta L z of GCs in our sample. The black dotted line marks the boundary between in situ (lower E) and accreted (higher E) clusters. The colors indicate mean change in energy ΔE as the bar’s pattern speed slows from Ωb = 80 to 35 km s−1 kpc−1. Most of the GCs with ΔE > 0 are located around L z ∼ 1000 kpc km s−1 and E ∼ −0.7 × 10⁵ km2 s−2.
Other Images in This Article
Copyright and Terms & Conditions
© 2024. The Author(s). Published by the American Astronomical Society.
Copyright ©
2025 Astronomy Image Explorer. All Rights Reserved.