Image Details
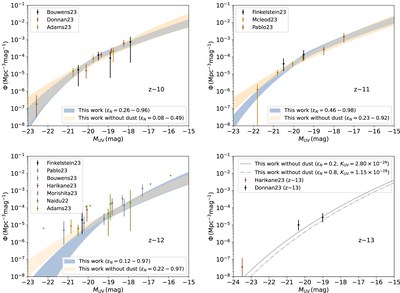
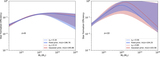
Caption: Figure 3.
The fit to the observations of UV LFs at the redshift range of 10 ≤ z ≤ 13. The selected JWST galaxies are taken from Finkelstein et al. (2022b), Naidu et al. (2022a), Adams et al. (2023), Bouwens et al. (2023a, 2023b), Donnan et al. (2023), Finkelstein et al. (2023), Harikane et al. (2023b), McLeod et al. (2023), Morishita & Stiavelli (2023), and Pérez-González et al. (2023). The blue and yellow regions represent the corresponding 90% credible regions of the estimated LFs with and without dust attenuation. The solid, dashed-gray lines represent qualitative cases of ﹩{{ \mathcal K }}_{\mathrm{UV}}﹩ and ϵ N, where the values of β and γ are fixed at the best fitting values. The observational data points are marked in circles with error bars, and the upper limits are shown in lower triangles.
Other Images in This Article
Copyright and Terms & Conditions
© 2023. The Author(s). Published by the American Astronomical Society.