Image Details
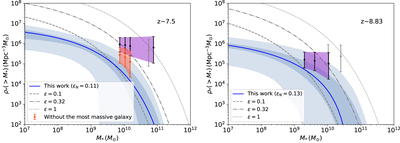
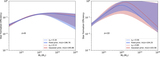
Caption: Figure 2.
The comoving stellar mass density contained within galaxies that are more massive than M * at z ∼ 7.5 and z ∼ 8.9. The gray data points and lines are reproduced from Figure 2 in Boylan-Kolchin (2023). The solid blue lines are the best-fit ρ *( > M *) considering the best-fit result of SFE at z = 8 and z = 9, respectively. The slightly dark blue regions represent the 90% credible regions of the estimated ρ *, while the light blue regions represent the additional contributions of cosmic variance (CV). The purple regions show the updated observations from Labbé et al. (2023). Particularly, in the left panel, the orange region represents the cumulative stellar mass density excluding the single/most massive galaxy with ﹩\mathrm{log}({M}_{* }/{M}_{\odot })\sim 10.89﹩, suggesting that such a single galaxy dominates and magnifies ρ *( > M *) significantly. This most massive galaxy has not been confirmed or excluded by spectroscopic evidence because of no data up to now.
Other Images in This Article
Copyright and Terms & Conditions
© 2023. The Author(s). Published by the American Astronomical Society.