Image Details
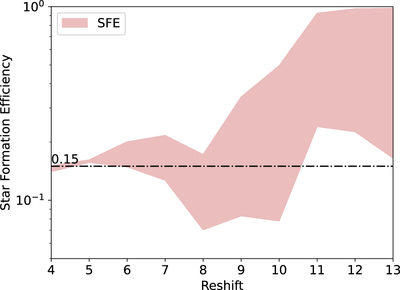
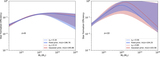
Caption: Figure 4.
The evolution of peak SFE with redshift. The shaded pink region represents the range of maximum SFE values with a 68% credible uncertainty at each redshift. At z ≥ 10, the estimation of SFE is performed without considering the impact of dust attenuation.
Other Images in This Article
Copyright and Terms & Conditions
© 2023. The Author(s). Published by the American Astronomical Society.
Copyright ©
2026 Astronomy Image Explorer. All Rights Reserved.