Image Details
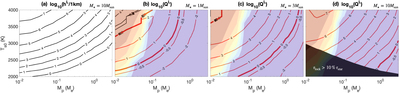
Caption: Figure 2.
(a) shows the equilibrium height of the load (assuming M ⋆ = 10 × solar mass, other solar masses yield similar results). (b)–(d) show the nondimensional load size Q as a function of insolation level (measured by the substellar point temperature T s0) and planetary mass M p , for M ⋆ = 1, 3, and 10 M Sun, respectively. Red contours denote positive Q L and black contours denote negative Q L . The black shading in (b)–(d) marks the parameter combinations where the timescale for a specific planet to get tidally locked τ lock is greater than 10% of the lifespan of the star τ star. The colorful shading overlaid shows atmospheric escape rate obtained from the analytical model in Kang et al. (2021). Red color corresponds to escape rate beyond 1012 kg s−1 and blue color corresponds to escape rate below 102 kg s−1. With an escape rate of 107 kg s−1, it will take 0.2 Gyr to completely vaporize a planet of 0.01 M e . In panels (b)–(d), areas encompassed by the bold 0-contour are likely to undergo TPW.
Other Images in This Article
Copyright and Terms & Conditions
© 2023. The Author(s). Published by the American Astronomical Society.