Image Details
Caption: Figure 1.
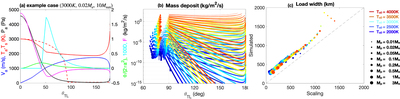
Panel (a) shows the air temperature T a (red, left), pressure P a (black, left), velocity V a (blue, left), surface temperature (red dashed, left), mass transport flux Φ (green, right), condensation D (cyan, right) and surface mass flux F (magenta, right) for an example case, where T s0 = 3000 K, M p = 0.02 M e and M ⋆ = 10 M Sun. Other stellar parameters can be derived from T s0 and M ⋆ following formula given in Table 1. Panel (b) shows the mass load profile. Mass deposited to the planetary surface by atmospheric flow out of the magma ocean can be sustained by the lithosphere, as shown by solid curves. Within the magma ocean edge (T s > T f = 1600 K), the total mass-loss rate per area is assumed to be evenly distributed, as shown by the vertical locations of the solid dots. The horizontal locations are set to the magma ocean edge minus 10°. Panel (c) compares the measured e-folding scale of the mass load out of the magma ocean l L against the theoretical prediction π RT s0/g. For panels (b) and (c), color indicates the temperature at the substellar point of the planet and line width, symbol size reflects the size of the planet; stellar mass M ⋆ is set to 10 M Sun.
Other Images in This Article
Copyright and Terms & Conditions
© 2023. The Author(s). Published by the American Astronomical Society.