Image Details
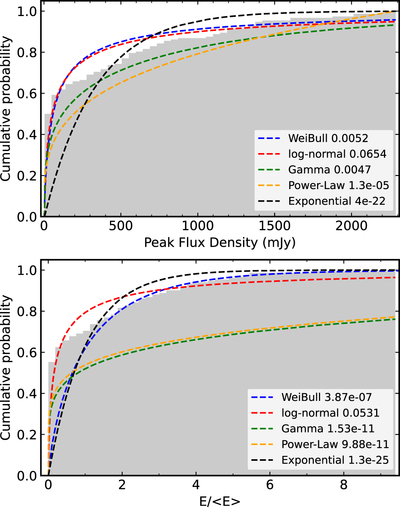
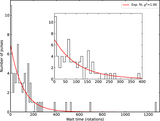
Caption: Figure 7.
Normalized cumulative distribution of pulse peak flux (upper panel) and the energy (the lower panel) for single pulses detected. The best-fit log-normal is shown in the red dashed curve. In addition we fit the distribution with a pure Weibull (blue), gamma (green), power law (orange), and exponential (black), respectively, which cannot describe the observed distribution well. The numbers in the legend are the p values corresponding to the fitted distributions.
Other Images in This Article
Copyright and Terms & Conditions
© 2022. The Author(s). Published by the American Astronomical Society.
Copyright ©
2026 Astronomy Image Explorer. All Rights Reserved.