Image Details
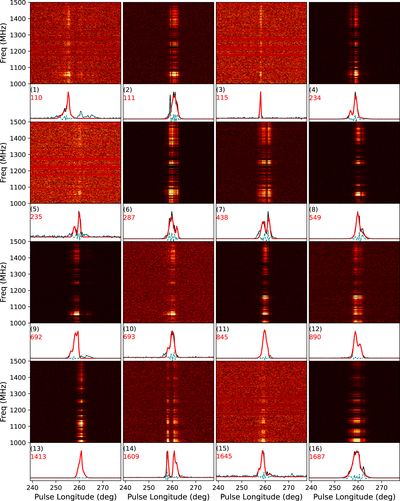
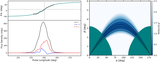
Caption: Figure 1.
Sample of single pulses of RRAT J0139+3336. The dedispersed frequency-time plot for the single pulse is displayed in the top panel. The black line in the bottom panel of each plot shows the pulse profile after accumulating the frequencies, and the red line is the fitted multi-Gaussian Gaussian template. The green dashed line indicates the difference between the fitted line and the observed profile. Red numbers are the index of single pulses.
Other Images in This Article
Copyright and Terms & Conditions
© 2022. The Author(s). Published by the American Astronomical Society.
Copyright ©
2026 Astronomy Image Explorer. All Rights Reserved.