Image Details
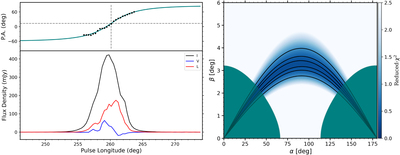
Caption: Figure 6.
Left: the polarization profile at 1.25 GHz, including total intensity (black curve), linear polarization (red curve), and circular polarization (blue curve). Upper panel shows the linear polarization position angle in degrees, and green curve represents the fitting result using RVM model. Right: the results of fitting an RVM curve for each (α, β) combination. The reduced chi-squared of the fit is expressed in terms of color depth, with darker blue values corresponding to a better fit. The black contours correspond to 1σ−, 2σ−, and 3σ confidence boundaries. The green areas indicate the constraints given according to certain theoretical assumptions and observed parameters.
Other Images in This Article
Copyright and Terms & Conditions
© 2022. The Author(s). Published by the American Astronomical Society.