Image Details
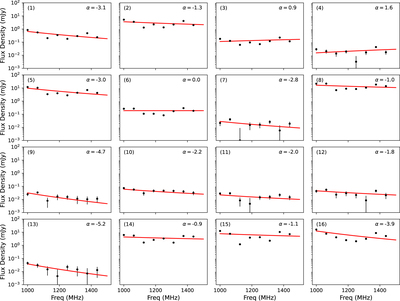
Caption: Figure 4.
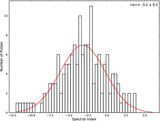
Fitting a sample of single-pulse spectral indices for RRAT J0139+3336. The spectral index fit for each single pulse corresponds to the single pulse in Figure 1. Each pulse spectral index fit has the same frequency and flux density scales. The scaled mean flux density is obtained from Equation (5) and is plotted against frequency in logarithmic space.
Other Images in This Article
Copyright and Terms & Conditions
© 2022. The Author(s). Published by the American Astronomical Society.
Copyright ©
2026 Astronomy Image Explorer. All Rights Reserved.