

Image Details
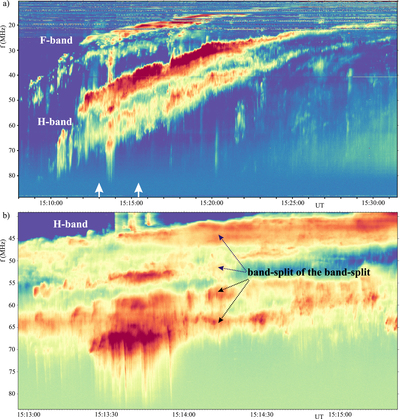
Caption: Figure 2.
Dynamic spectrum observed by LOFAR showing (a) the type II burst observed at full resolution and (b) the band-split of the band-split. The white arrows at the bottom of dynamic spectrum in panel (a) indicate the time interval plotted in panel (b).
Other Images in This Article
Copyright and Terms & Conditions
© 2020. The American Astronomical Society. All rights reserved.

Copyright ©
2026 Astronomy Image Explorer. All Rights Reserved.
