

Image Details
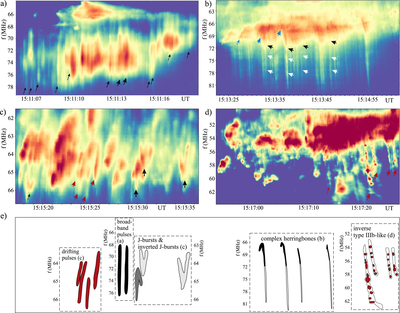
Caption: Figure 4.
LOFAR dynamic spectra showing (a) broadband pulses, (b) complex herringbones (blue arrows denote the J part of the burst, black arrows denote “the break” in the burst indicating a change in the frequency drift), (c) J-bursts and drifting pulses (marked with black and red arrows, respectively), (d) inverse type IIIb-like bursts composed of narrowband dot-like FSs in a faint drifting envelope, and (e) a one-to-one schematic presentation of selected broadband FSs shown in panels (a)–(d).
Other Images in This Article
Copyright and Terms & Conditions
© 2020. The American Astronomical Society. All rights reserved.

Copyright ©
2026 Astronomy Image Explorer. All Rights Reserved.
