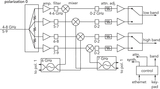
Image Details
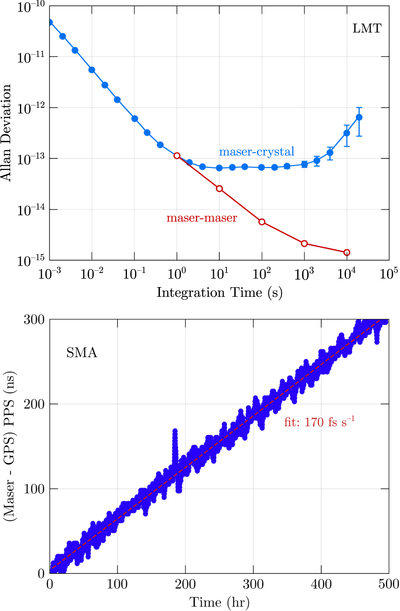
Caption: Figure 5.
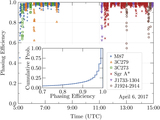
Top panel: measured Allan standard deviation, ﹩{\sigma }_{y}(\tau )﹩, of the hydrogen maser at the LMT compared to a precision quartz oscillator. The open red points are the manufacturer specifications of the hydrogen maser when compared to another maser. At a 1 s integration time, the quartz oscillator and maser have similar stability, so the measurements indicate that the maser is meeting its specifications as installed at a coherence time of ∼1 s. The flattening of the ﹩{\sigma }_{y}(\tau )﹩ curve beyond 10 s is due to the decreased stability of the quartz crystal. The extrapolation of Allan deviation from short integration times to 10 s indicates that the maser meets the stability goal of ﹩{\sigma }_{y}(10\,{\rm{s}})=1.5\times {10}^{-14}﹩. Bottom panel: the long-term drift of the maser at the SMA compared to GPS, measured by differencing the 1 PPS ticks from the maser and local GPS receiver. The vertical width of the trace is due to variable ionospheric and tropospheric delays of the GPS signal (including the excursion near hour 200), while the long-term trend represents the frequency error of the maser. The drift measured from this plot, and its effects on the fringe visibility, are removed during VLBI correlation.
Other Images in This Article


Show More
Copyright and Terms & Conditions
© 2019. The American Astronomical Society.