Image Details
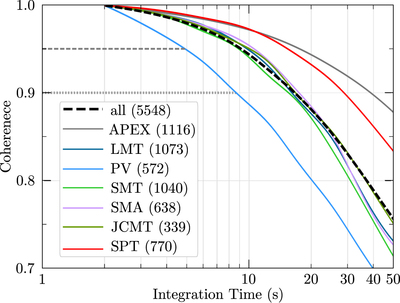
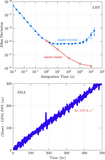
Caption: Figure 2.
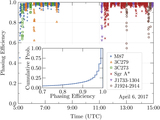
Atmospheric coherence time for EHT ALMA baselines. VLBI observations consist of scans, each ∼3–7 minutes long (see Figure 12). Each scan in the 2017 EHT observation campaign was divided into sequential coherent integration intervals, which were then incoherently averaged to obtain an estimate of VLBI signal amplitude per scan. As the duration of the coherent interval decreases, the loss in amplitude due to atmospheric phase fluctuations decreases. Solid lines represent the 25th percentile of the coherence distribution for each baseline: 75% of the data exhibit higher time coherence than indicated by the line. The heavy black dashed line shows the 25th percentile of the coherence distribution for all baselines. The light dashed and dotted lines show the 95 % and 90 % coherence limits for the baseline with lowest coherence, which is from PV to ALMA (largely due to low-elevation PV scans on Sgr A* during the observations). The number of scans used to compute the coherence curves are shown next to each station in parenthesis.
Other Images in This Article
Show More
Copyright and Terms & Conditions
© 2019. The American Astronomical Society.