

Image Details
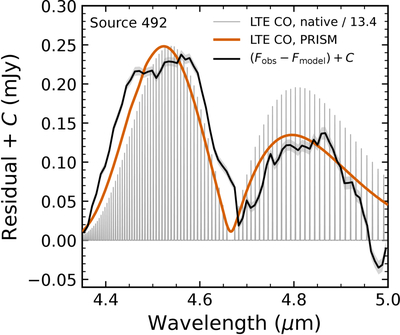
Caption: Figure 6.
Residual spectrum (black) of Source 492 after subtracting the adopted model, with a constant offset applied to account for possible overestimation of the thermal continuum. The thin gray curve shows an illustrative TCO = 1500 K LTE CO v = 1–0 spectrum constructed using CO line parameters from HITRAN2020 (I. E. Gordon et al. 2022) and rescaled for display. The orange curve shows the same template degraded to the observed PRISM sampling. The residual morphology is broadly consistent with emission from warm-CO gas.
Other Images in This Article
Copyright and Terms & Conditions
© 2026. The Author(s). Published by the American Astronomical Society.

Copyright ©
2026 Astronomy Image Explorer. All Rights Reserved.
