

Image Details
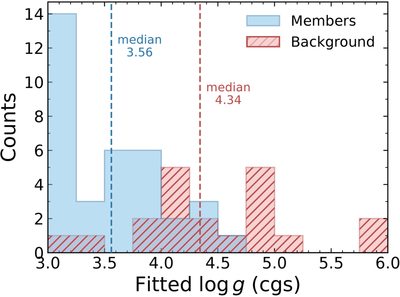
Caption: Figure 3.
Distributions of the fitted ﹩\mathrm{log}g﹩ posterior medians for sources selected using the maximum-likelihood criterion ﹩{f}_{{\rm{th}}}^{1-2.6}\lt 0.1﹩. Blue unhatched and red hatched histograms represent 35 candidate NGC 2024 members and the 20 “Background” sources remaining after the 7 B* sources with independent evidence suggesting NGC 2024 membership are excluded, respectively. Both distributions use a bin width of 0.25 dex. Dashed lines mark the corresponding median values. The fitted ﹩\mathrm{log}g﹩ values are used only as a population-level classification check.
Other Images in This Article
Copyright and Terms & Conditions
© 2026. The Author(s). Published by the American Astronomical Society.

Copyright ©
2026 Astronomy Image Explorer. All Rights Reserved.
