

Image Details
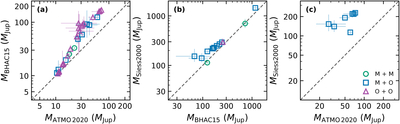
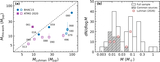
Caption: Figure 4.
Comparison of the model-dependent masses obtained for the same sources using (a) ATMO 2020 and BHAC15, (b) BHAC15 and the L. Siess et al. (2000) models, and (c) ATMO 2020 and the L. Siess et al. (2000) models. Green circles denote sources whose masses are obtained by grid interpolation with both models, blue squares those using grid interpolation for one model and a temperature-based estimate for the other, and purple triangles those using temperature-based estimates for both models. The legend codes “M” and “O” denote matched and overluminous, respectively. For the blue squares, the horizontal-axis masses are temperature based, while the vertical-axis masses are obtained by grid interpolation. Sources with uncertain classifications are excluded. Error bars show the 16th–84th percentile intervals, and the dashed lines indicate equal masses.
Other Images in This Article
Copyright and Terms & Conditions
© 2026. The Author(s). Published by the American Astronomical Society.

