

Image Details
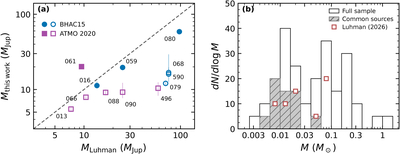
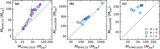
Caption: Figure 5.
Comparison of our mass estimates and mass distributions with those of K. L. Luhman (2026). (a) Mass estimates for 12 common sources. Blue circles and purple squares indicate masses derived using the BHAC15 and ATMO 2020 evolutionary models, respectively. Filled markers indicate joint Teff–Lbol interpolation, while open markers indicate temperature-based estimates. Vertical error bars show our adopted mass uncertainties. The dashed line marks equal masses. (b) Mass distributions of the same 12 sources using our mass estimates (gray hatched histogram) and the estimates of K. L. Luhman (2026) (red squares). The full sample of 46 candidate members in this work is shown as a white histogram with black outlines.
Other Images in This Article
Copyright and Terms & Conditions
© 2026. The Author(s). Published by the American Astronomical Society.

