

Image Details
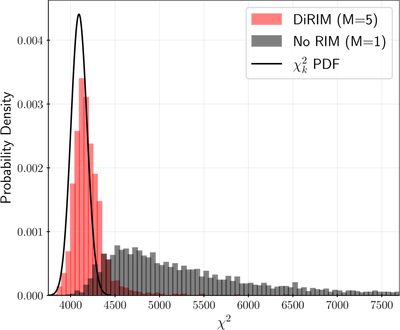
Caption: Figure 8.
Distribution of χ2 values computed using simulated observations from the test set and the image reconstructions obtained from posterior samples. The χ2 value is computed for one posterior sample for each observation in the test set, and the resulting distribution is compared to the ﹩{\chi }_{k}^{2}﹩ probability density function with k = 642. The red histogram is obtained using our methods, while the black histogram is obtained by removing the RIM from our methods, mimicking the behavior of baseline conditional denoising score matching.
Other Images in This Article
Show More
Copyright and Terms & Conditions
© 2026. The Author(s). Published by the American Astronomical Society.

Copyright ©
2026 Astronomy Image Explorer. All Rights Reserved.
