

Image Details
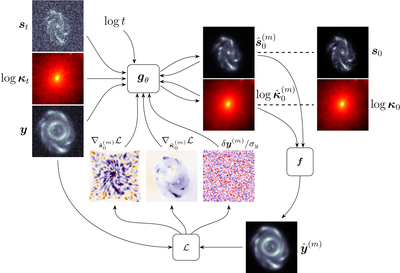
Caption: Figure 1.
Graphical representation of DiRIM for strong gravitational lensing. A neural network gθ is trained to denoise noisy source galaxy images st and noisy convergence map images ﹩\mathrm{log}{{\boldsymbol{\kappa }}}_{t}﹩ given lens observations y. It iteratively updates its estimate of the denoised source and convergence map ﹩({\hat{{\boldsymbol{s}}}}_{0},\mathrm{log}{\hat{{\boldsymbol{\kappa }}}}_{0})﹩ using the RIM framework. The dashed lines represent the loss function Equation (16) (with ﹩{\boldsymbol{x}}\equiv ({\boldsymbol{s}},\mathrm{log}{\boldsymbol{\kappa }}))﹩, and the trained gθ is used to determine posterior scores ﹩{{\rm{\nabla }}}_{{{\boldsymbol{s}}}_{t},\mathrm{log}{{\boldsymbol{\kappa }}}_{t}}\mathrm{log}{p}_{t}({{\boldsymbol{s}}}_{t},\mathrm{log}{{\boldsymbol{\kappa }}}_{t}| {\boldsymbol{y}})﹩ needed to obtain samples from the posterior ﹩p({{\boldsymbol{s}}}_{t},\mathrm{log}{{\boldsymbol{\kappa }}}_{t}| {\boldsymbol{y}})﹩ via diffusion-based generative modeling. In this figure, t ∈ [0, T] denotes the diffusion time, m ∈ [0, M] denotes the RIM iteration, f denotes the forward model, ﹩{ \mathcal L }﹩ denotes the negative log-likelihood function, and δy denotes the residuals between the observation y and the modeled image ﹩\hat{{\boldsymbol{y}}}﹩.
Other Images in This Article
Show More
Copyright and Terms & Conditions
© 2026. The Author(s). Published by the American Astronomical Society.

