

Image Details
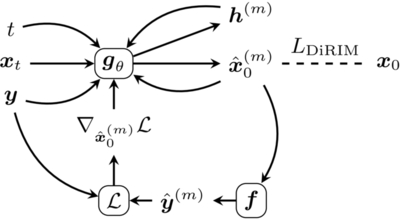
Caption: Figure 4.
Graphical representation of DiRIM. A neural network gθ is trained to denoise noisy model parameters xt given t and observations y. It does so by iteratively updating its prediction ﹩{\hat{{\boldsymbol{x}}}}_{0}﹩ using the RIM framework. The dashed line represents the loss function in Equation (16). This computation graph corresponds to a superimposition of the computation graphs in Figures 2 and 3.
Other Images in This Article
Show More
Copyright and Terms & Conditions
© 2026. The Author(s). Published by the American Astronomical Society.

Copyright ©
2026 Astronomy Image Explorer. All Rights Reserved.
