

Image Details
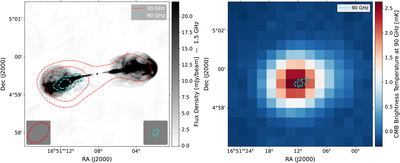
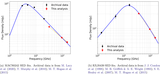
Caption: Figure 6.
Left: 1.5 GHz emission from Hercules A, at the center of RXJ1615, as observed by R. Timmerman et al. (2022). We overlay 10σ, 30σ, and 100σ (30 GHz only) contours from our CLEAN maps of the CARMA data at 30 and 90 GHz in red and cyan, respectively. We also add elliptical dashed patches showing the synthesized beam at 30 and 90 GHz in red and cyan, respectively, in the bottom corners. Right: ACT 90 GHz map with the SZ model for RXJ1615 subtracted, with the 10σ and 30σ contours from the 90 GHz CLEAN maps overlaid.
Other Images in This Article
Copyright and Terms & Conditions
© 2026. The Author(s). Published by the American Astronomical Society.

Copyright ©
2026 Astronomy Image Explorer. All Rights Reserved.
