

Image Details
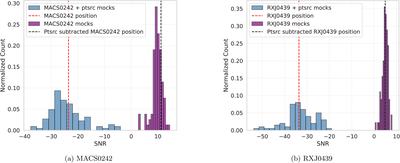
Caption: Figure 3.
Histograms in blue show the SNR distribution from mock observations of the cluster SZ signal based on the X-ray-derived pressure profile plus the bright central AGN, with the actual SNR from the location of the cluster shown in the red line. Histograms in purple show the SNR distribution from mock observations that include only the SZ signal (i.e., no central AGN), with the actual SNR from the location of the cluster following subtraction of the AGN emission shown in the black line.
Other Images in This Article
Copyright and Terms & Conditions
© 2026. The Author(s). Published by the American Astronomical Society.

Copyright ©
2026 Astronomy Image Explorer. All Rights Reserved.
