

Image Details
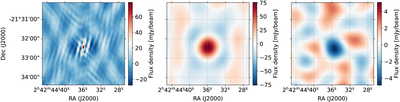
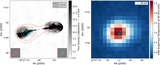
Caption: Figure 1.
Left: CARMA data for long baselines (≥3kλ) for MACS0242, dominated by AGN emission. Middle: CARMA short-baseline (≤3kλ) data for MACS0242. Right: residual CARMA short-baseline map, after subtracting the AGN emission and revealing the SZ decrement from the cluster.
Other Images in This Article
Copyright and Terms & Conditions
© 2026. The Author(s). Published by the American Astronomical Society.

Copyright ©
2026 Astronomy Image Explorer. All Rights Reserved.
