

Image Details
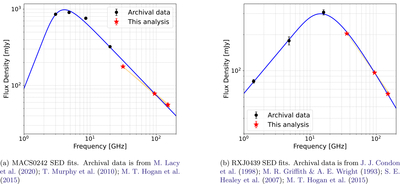
Caption: Figure 4.
SED fits in blue to the flux densities of the AGN cores in the CGs of MACS0242 and RXJ0439 using Equation (2), with black points corresponding to previous measurements from the literature and red stars corresponding to our measurements, including those obtained at 150 GHz from the ACT data based on subtracting an X-ray-derived model of the SZ signal. Error bars are shown for both the archival and new measurements, but their small values render them invisible on the log-log plots. Because calibration uncertainties and source variability across frequencies and epochs dominate over the measurement uncertainties, we instead assumed a uniform 10% fractional uncertainty when fitting the SED model. The shaded orange region corresponds to the 68% confidence interval for the simple linear extrapolation from our CARMA measurements.
Other Images in This Article
Copyright and Terms & Conditions
© 2026. The Author(s). Published by the American Astronomical Society.

